

Let us know what we can call you and how we can provide you with more information!
The Market places leading BI tool, Microsoft BI is now inside ConstructionCRM -Enabling your business to realise the full potential of your data. Power BI compliments ConstructionCRM and your construction Data to make an unbeatable competitor rich platform for your business.
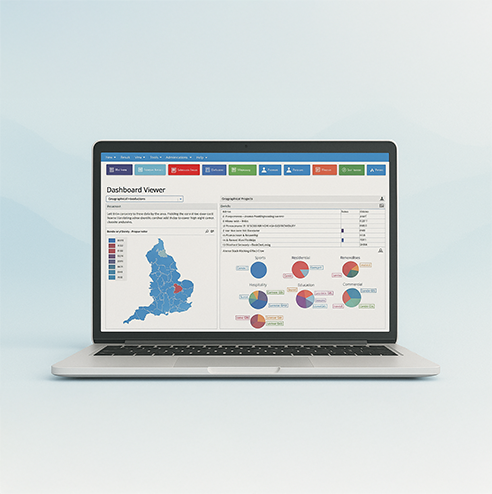
With PowerBI connected to ConstructionCRM, your customer account data becomes instantly visual and actionable. See trends in account activity, sales performance, pipelines, and client engagement all in one dynamic dashboard. Instead of digging through reports, you get clear insights that help you prioritise the right customers and make faster, more confident decisions.

PowerBI transforms your marketing data into meaningful insights that help you target smarter. Track campaign performance, identify high-value customer segments, compare lead sources, and spot trends in engagement — all pulled directly from ConstructionCRM. With real-time dashboards, your marketing team can refine strategy quickly and focus on what delivers the strongest return.

Companies that forecast well have a competitive advantage as it helps your business stay agile. Power BI consolidates all your data in one place and simplifies it, and presents to you the most accurate, up-to-date information that is visualized through powerful reports. Having access to all your historical sales patterns and activity in one place makes it easier to project future revenue and sales accurately.

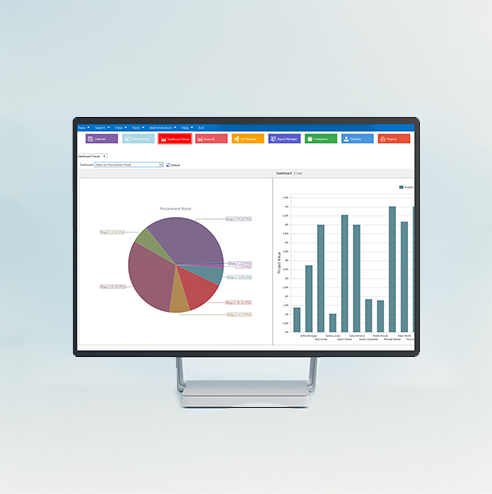
ConstructionCRM powers project success for top contractors, architects, and suppliers. Power BI provides a whole range of reporting visualisations, right from simple bar charts to pie charts. To create the visualisation, you can drag the field names from the fields plane and drop them into the report canvas, and choose the type of visualisation. You can enhance the interactivity further by adding an on-canvas visual filter like a slicer. This allows anyone looking at the data to segment the data by a particular value. across the sector.